mqr.plot.spc.
oc#
- mqr.plot.spc.oc(n, c, ax, defect_range=None, line_kws=None)#
Plot an OC curve.
- Parameters:
- nint
Sample size.
- cint
Acceptance number.
- axmatplotlib.axes.Axes
Axes for the plot.
- defect_rangetuple[float, float], optional
Range of defect rates to show (on the x-axis).
- line_kwsdict, optional
Keyword args for the line. Passed to
matplotlib.pyplot.plot.
Examples
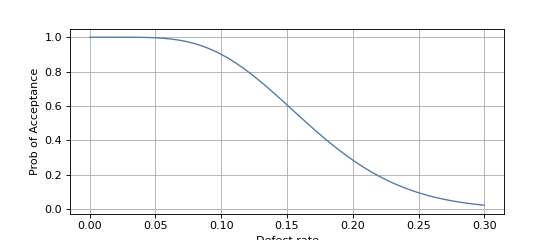
This example shows an OC curve with sample size 40 and acceptance number 6. The plot shows only defect rates between 0 to 0.3 (along the x axis).
fig, ax = plt.subplots(figsize=(7, 3))

mqr.plot.spc.oc(n=40, c=6, defect_range=(0, 0.3), ax=ax)
(
Source code,png,pdf)