alarms#
- mqr.plot.spc.alarms(control_statistic, control_params, control_rule, ax, *, point_kws=None, span_kws=None)#
Plots alarms over a control chart.
The control statistic and control parameters should be the same as the values passed to the chart(…) that drew the plot over which these alarms will be drawn.
Alarm points are marked two ways:
a marker (a red dot by default) drawn over the statistic point, and
a region of colour (red by default) showing the span of alarmed points.
Either can be switched off using point_kws/span_kws.
- Parameters:
- control_statisticmqr.spc.ControlStatistic
The control statistic from samples of a monitored process.
- control_paramsmqr.spc.ControlParams
The control parameters, usually calculated from reference/historical data.
- control_ruleCallable[[ControlStatistic, ControlParams], pandas.Series[bool]]
A map from the control statistic and control parameters to a series of bools with a corresponding index, where True values are an alarm at that index.
- axmatplotlib.axes.Axes
- point_kwsdict, optional
Keyword args for the alarm markers (matplotlib.pyplot.plot).
- span_kwsdict, optional
Keyword args for the alarm regions (matplotlib.pyplot.axvspan).
Examples
This example shows an X-bar chart (sample mean) of a process with mean 1 and standard deviation 5, using sample sizes of 6 observations. A total of 20 samples are shown. The limits are 2 standard deviations of the standard error of the mean.
fig, ax = plt.subplots(figsize=(7, 3))

# Raw data
np.random.seed(0)
x = pd.DataFrame(
    scipy.stats.norm(1, 5).rvs([20, 6]),
    columns=range(6))

# Parameters
params = mqr.spc.XBarParams(centre=1, sigma=5, nsigma=2)
stat = params.statistic(x)
rule = mqr.spc.rules.limits()

# Charts
mqr.plot.spc.chart(stat, params, ax=ax)
mqr.plot.spc.alarms(stat, params, rule, ax=ax)
(
Source code,png,pdf)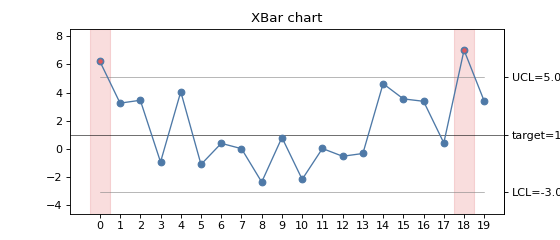