mqr.plot.
ishikawa#
- mqr.plot.ishikawa(problem: str, causes: dict[str, list[str]], ax, ishikawa_kws=None)#
Draws an Ishikawa/fishbone diagram.
Draws the “spine”, and other levels of “bones”. Express the label for the spine as the problem paramerter. Express the two levels of causes as a dictionary of lists: the key to each dictionary names the first branch from the spine, the list of values name secondary branches.
- Parameters:
- problemstr
Label for the main spine.
- causesdict[str, list[str]]
Mapping from string values which are labels for the first branches to list-of-string keys which are labels for the next level causes.
- axmatplotlib.axes.Axes
Axes for the plot.
- ishikawa_kwsdict, optional
Keys overriding
mqr.plot.defaults.Defaults.ishikawa.
Examples
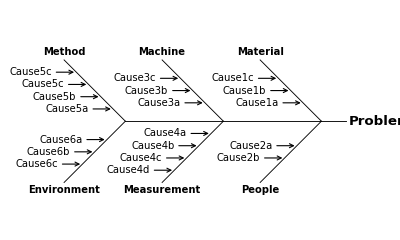
This example shows a diagram with the main spine labelled as “Problem”. Two branches leave the spine, then other branches leave those.
import mqr

fig, ax = plt.subplots(figsize=(5, 3))

problem = 'Problem'
causes = {
    'Material':    ['Cause1a', 'Cause1b', 'Cause1c'],
    'People':      ['Cause2a', 'Cause2b'],
    'Machine':     ['Cause3a', 'Cause3b', 'Cause3c'],
    'Measurement': ['Cause4a', 'Cause4b', 'Cause4c', 'Cause4d'],
    'Method':      ['Cause5a', 'Cause5b', 'Cause5c', 'Cause5c'],
    'Environment': ['Cause6a', 'Cause6b', 'Cause6c'],
}
mqr.plot.ishikawa(problem, causes, ax=ax)

plt.show()
(
Source code,png,pdf)