mqr.plot.spc.
chart#
- mqr.plot.spc.chart(control_statistic, control_params, ax, *, line_kws=None, in_kws=None, out_kws=None, target_kws=None, control_kws=None)#
Plots an control chart defined by ControlParams.
- Parameters:
- control_statisticmqr.spc.ControlStatistic
The control statistic from samples of a monitored process.
- control_paramsmqr.spc.ControlParams
The control parameters, usually calculated from reference/historical data.
- axmatplotlib.axes.Axes
Axes for the plot.
- line_kwsdict, optional
Keyword args for the statistic line (matplotlib.pyplot.plot).
- target_kwsdict, optional
Keyword args for the target line (matplotlib.pyplot.axhline).
- control_kwsdict, optional
Keyword args for the control lines (matplotlib.pyplot.plot).
Examples
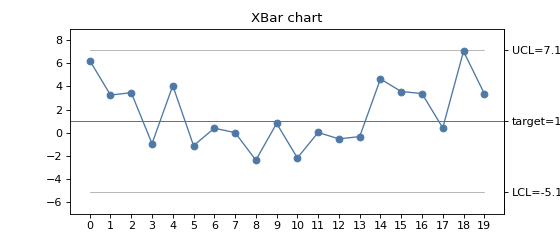
This example charts the X-bar chart (sample mean) of a process with mean 1 and standard deviation 5, using sample sizes of 6 observations. A total of 20 samples are shown.
fig, ax = plt.subplots(figsize=(7, 3))

# Raw data
np.random.seed(0)
x = pd.DataFrame(scipy.stats.norm(1, 5).rvs([20, 6]))

# Parameters
params = mqr.spc.XBarParams(centre=1, sigma=5)
stat = params.statistic(x)

# Charts
mqr.plot.spc.chart(stat, params, ax=ax)
(
Source code,png,pdf)