mqr.plot.anova.
main_effects#
- mqr.plot.anova.main_effects(data, response, factors, *, axs, line_kws=None, mean_kws=None)#
Plot the main effects from experimental data.
- Parameters:
- datapandas.DataFrame
- responsestr
- factorslist[str]
- axsarray_like[matplotlib.axes.Axes]
Axes for the plot. Must have the same number of elements as factors. Will be flattened before use.
- line_kwsdict, optional
Keyword args for the effect lines. Passed to
matplotlib.pyplot.plot.- mean_kwsdict, optional
Keyword args for the overall average line. Passed to
matplotlib.pyplot.axhline.
Examples
This example loads sample data and shows a main effects plot for the two factors.
data = pd.read_csv(mqr.sample_data('anova-glue.csv'), index_col='Run')

fig, axs = plt.subplots(1, 2, figsize=(5, 2), layout='constrained')
mqr.plot.tools.sharey(fig, axs)
mqr.plot.anova.main_effects(
    data,
    response='adhesion_force',
    factors=['primer', 'glue'],
    axs=axs)
(
Source code,png,pdf)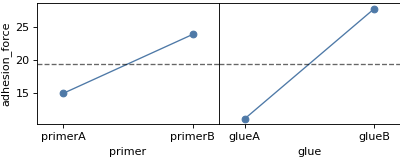