mqr.plot.anova.
interactions#
- mqr.plot.anova.interactions(data, response, group, factors, *, axs, line_kws=None, mean_kws=None)#
Interaction plot for observation obs between the two categories in between.
- Parameters:
- datapd.DataFrame
Table of categorical data.
- responsestr
Column name that contains response (real numbers).
- groupstr
Categorical factor whose values are shown as separate lines on each plot.
- factorslist[str]
Categorical factors whose interactions with group are plot on each axis.
- axsmatplotlib.axes.Axes, list[matplotlib.axes.Axes]
Axes for the plot. Must match the length of factors (if the length of factors is 1, then axs can be an axes object).
- line_kwsdict, optional
Keyword arguments for the lines. Passed to
matplotlib.pyplot.plot.- mean_kwsdict, optional
Keyword arguments for the mean line. Passed to
matplotlib.pyplot.axhline.
Examples
This example loads sample data and shows an interaction plot for the two factors. Since one factor is used for grouping, there is one factor left for plots.
data = pd.read_csv(mqr.sample_data('anova-glue.csv'), index_col='Run')

fig, axs = plt.subplots(figsize=(3, 2), layout='constrained')
mqr.plot.anova.interactions(
    data,
    response='adhesion_force',
    group='primer',
    factors=['glue'],
    axs=axs)
(
Source code,png,pdf)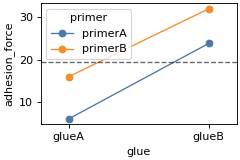