mqr.plot.
confint#
- mqr.plot.confint(ci: ConfidenceInterval, ax, hyp_value=None, interval_kws=None, mean_kws=None, hyp_kws=None)#
Draw a confidence interval with an hypothesised value; a graphical representation of an hypothesis test.
When the the hypothesised value (hyp_value) is outside the confidence interval, the null-hypothesis is refejected at the confidence level used to construct the interval (ci.conf).
Representing this relationship graphically makes sense when the distribution of the test statistic is the distribution of the sample. For example, in an hypothesis test for the mean of a sample, using a z-score as the test statistic.
- Parameters:
- cimqr.confint.ConfidenceInterval
The confidence interval to draw.
- axmatplotlib.axes.Axes
Axes for the plot.
- hyp_valuefloat, optional
The null-hypothesis value.
Examples
Show a confidence interval on the mean.
import mqr

ci = mqr.inference.mean.confint_1sample(
    np.array([1, 5, 4, 3, 6, 2, 3, 3, 2, 5]),
    conf=0.98,
)

fig, ax = plt.subplots(figsize=(5, 2))
mqr.plot.confint(ci, ax, hyp_value=3)
plt.show()
(
Source code,png,pdf)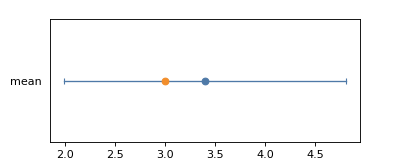