combine#
- mqr.spc.rules.combine(combn_fn, *rules)#
Create a new rule from others and a logical combination.
A word on types. This function can be confusing because it transforms functions into another function. The list of arguments rules and the result of this function all have the same signature. Take a look at
limitsfor an example of that signature. On the other hand, combn_fn has a different signature: it takes two series of bools and returns another series of bools whose elements correspond to the first two. That is, it takes results from two rules and makes a new result. See the example below.The new rule is the same as evaluating each rule in rules, then combining the outputs with combn_fn(left_result, right_result) from left to right.
- Parameters:
- combn_fnCallable[[[Series[bool], pandas.Series[bool]], pandas.Series[bool]]
Function that combines the result series from two rules into a single Series.
- *rulesCallable[[ControlStatistic, ControlParams], Series[bool]]
One or more rules whose results will be combined.
Examples
Creating a combination
This example creates a combination function that alarms when both of its inputs are alarmed, but not when only one is an alarm.
>>> def both(series1, series2):
>>>     result = pd.Series(index=series1.index, dtype=bool)
>>>     for i in range(len(result)):
>>>         result[i] = series1[i] and series2[i]
>>>     return result
That code demonstrates the interface with a simple example, but in practise, use
numpy.logical_andfor the functionality of “both” above, since it is much more efficient, and already written:>>> mqr.spc.rules.combine(np.logical_and, rule1, rule2)
Using a combination
Create a rule that alarms when either (1) a process goes outside its control limits using
mqr.spc.rules.limits, or (2) the process has 3 of 4 observations outside 2 sigmas usingmqr.spc.rules.aofb_nsigma. To make the numbers simple, the process here has standard deviation of 1 and samples of size 1 are taken – a single observation of 1 is then a sample with mean at 1 standard error.The data first violates the UCL of 3, with an average observation 3.5.
The data then violates the 3/4 outside 2sigma limit, with the four sample averages 2.5, 1, 2.5, 2.5 (three of which are bigger than 2). The last of these four observations is labelled as violating the limit.
fig, ax = plt.subplots(figsize=(7, 3))

# Make the new rule
combine_rule = mqr.spc.rules.combine(
    np.logical_or,
    mqr.spc.rules.limits(),
    mqr.spc.rules.aofb_nsigma(a=3, b=4, n=2))

# Create violating data for demonstration
mean = 5
sigma = 1
zscore = np.array([[0, 3.5, 0, 0, 0, 2.5, 1, 2.5, 2.5, 0]]).T
#                      ^^^(>UCL)     ^^^^^^^^^^^^^^^^(3/4>2)
data = pd.DataFrame(mean + zscore * sigma)

# Create parameters and calculate statistic for the example chart
params = mqr.spc.XBarParams(centre=mean, sigma=sigma)
stat = params.statistic(data)

# Show the chart and alarms overlay for the combined rule
mqr.plot.spc.chart(stat, params, ax=ax)
mqr.plot.spc.alarms(stat, params, combine_rule, ax=ax)
(
Source code,png,pdf)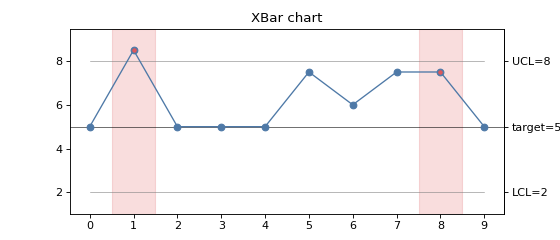