mqr.plot.anova.
model_means#
- mqr.plot.anova.model_means(result, response, factors, axs, ci_kws=None)#
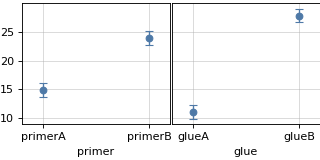
Plot the means of each combination of factor levels in an ANOVA result.
- Parameters:
- resultstatsmodels.regression.linear_model.RegressionResults
Result of calling fit on a statsmodel linear regression model.
- responsestr
Name of response variable.
- factorslist[str]
List of names of categorical factors.
- axsarray_like[matplotlib.axes.Axes]
Axes for the plot. Must have the same number of elements as factors. Will be flattened before use.
- ci_kws: dict, optional
Keyword args for confidence intervals. Passed to
matplotlib..errorbar.
Examples
This example performs an ANOVA on sample data, then shows the means of the factors.
from statsmodels.formula.api import ols

data = pd.read_csv(mqr.sample_data('anova-glue.csv'), index_col='Run')
model = ols('adhesion_force ~ C(primer) + C(glue)', data=data)
result = model.fit()

fig, axs = plt.subplots(1, 2, figsize=(4, 2), layout='constrained')
mqr.plot.tools.sharey(fig, axs)
mqr.plot.anova.model_means(
    result,
    response='adhesion_force',
    factors=['primer', 'glue'],
    axs=axs)
(
Source code,png,pdf)