Customising MQR plots#
- Additional imports
In addition to the user-guide imports, the pages (Plots, Plotting Primer and Customising MQR plots) also require the following imports.
from matplotlib import pyplot as plt
import seaborn as sns
Most plots in mqr can be customised. There are three main methods.
Change the defaults in
rc_paramsor stylesheets.Change the defaults in
mqr.plot.defaults.Defaults.Pass keyword arguments that override the defaults.
1. Changing rc_params and stylesheets#
See: Customizing Matplotlib with style sheets and rcParams.
The options in rc_params globally change the way that matplotlib renders plots.
Currently, mqr creates a set of rc_params in a context manager and uses that context at the same time as the Figure context.
You can change the defaults used in Figure by changing or replacing mqr.plot.defaults.Defaults.rc_params.
You can revert to the matplotlib defaults by setting mqr.plot.defaults.Defaults.rc_params = {}.
2. Changing mqr.plot.defaults.Defaults#
Some specific defaults that are used in several places have names in Defaults.
For example, the colour of the targets and control limit lines on control charts are taken from, eg.
mqr.plot.defaults.Defaults.target_color.
Whenever a marker is added to a plot that shows no markers by default,
the marker Defaults.marker is used.
3. Overriding defaults: **kwargs#
Many of the plots in mqr that are constructed from other plots in matplotlib
accept dictionaries of keyword arguments that are passed through to matplotlib.
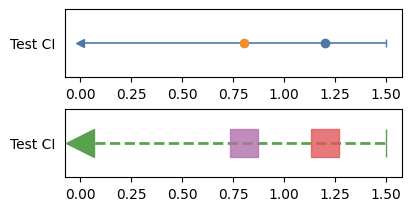
For example, when plotting a confidence interval, the elements can be customised, as below.
ci = mqr.inference.confint.ConfidenceInterval(
    name='Test CI',
    method='Manual',
    value=1.2, lower=-np.inf, upper=1.5,
    conf=0.98,
    bounded='above')

hyp_value = 0.8

i_kws = dict(color='C2', linestyle='--', linewidth=2.0, markersize=20, zorder=0)
m_kws = dict(color='C3',alpha=0.8,marker='s',markersize=20,zorder=1)
h_kws = dict(color='C4',alpha=0.8,marker='s',markersize=20,zorder=1)

with Figure(4, 2, 2, 1) as (fig, axs):
    mqr.plot.confint(
        ci,
        axs[0],
        hyp_value=hyp_value)
    mqr.plot.confint(
        ci,
        axs[1],
        hyp_value=hyp_value,
        interval_kws=i_kws,
        mean_kws=m_kws,
        hyp_kws=h_kws)